Totally.Digital data
Data: interactive charts and maps from UK open data
Totally.Digital builds interactive data visualisations from official UK statistics: ambulance response times, A&E waits, pay, rents and business openings and closures, by area, with the source, the edition and the limits of the data on every page.
-
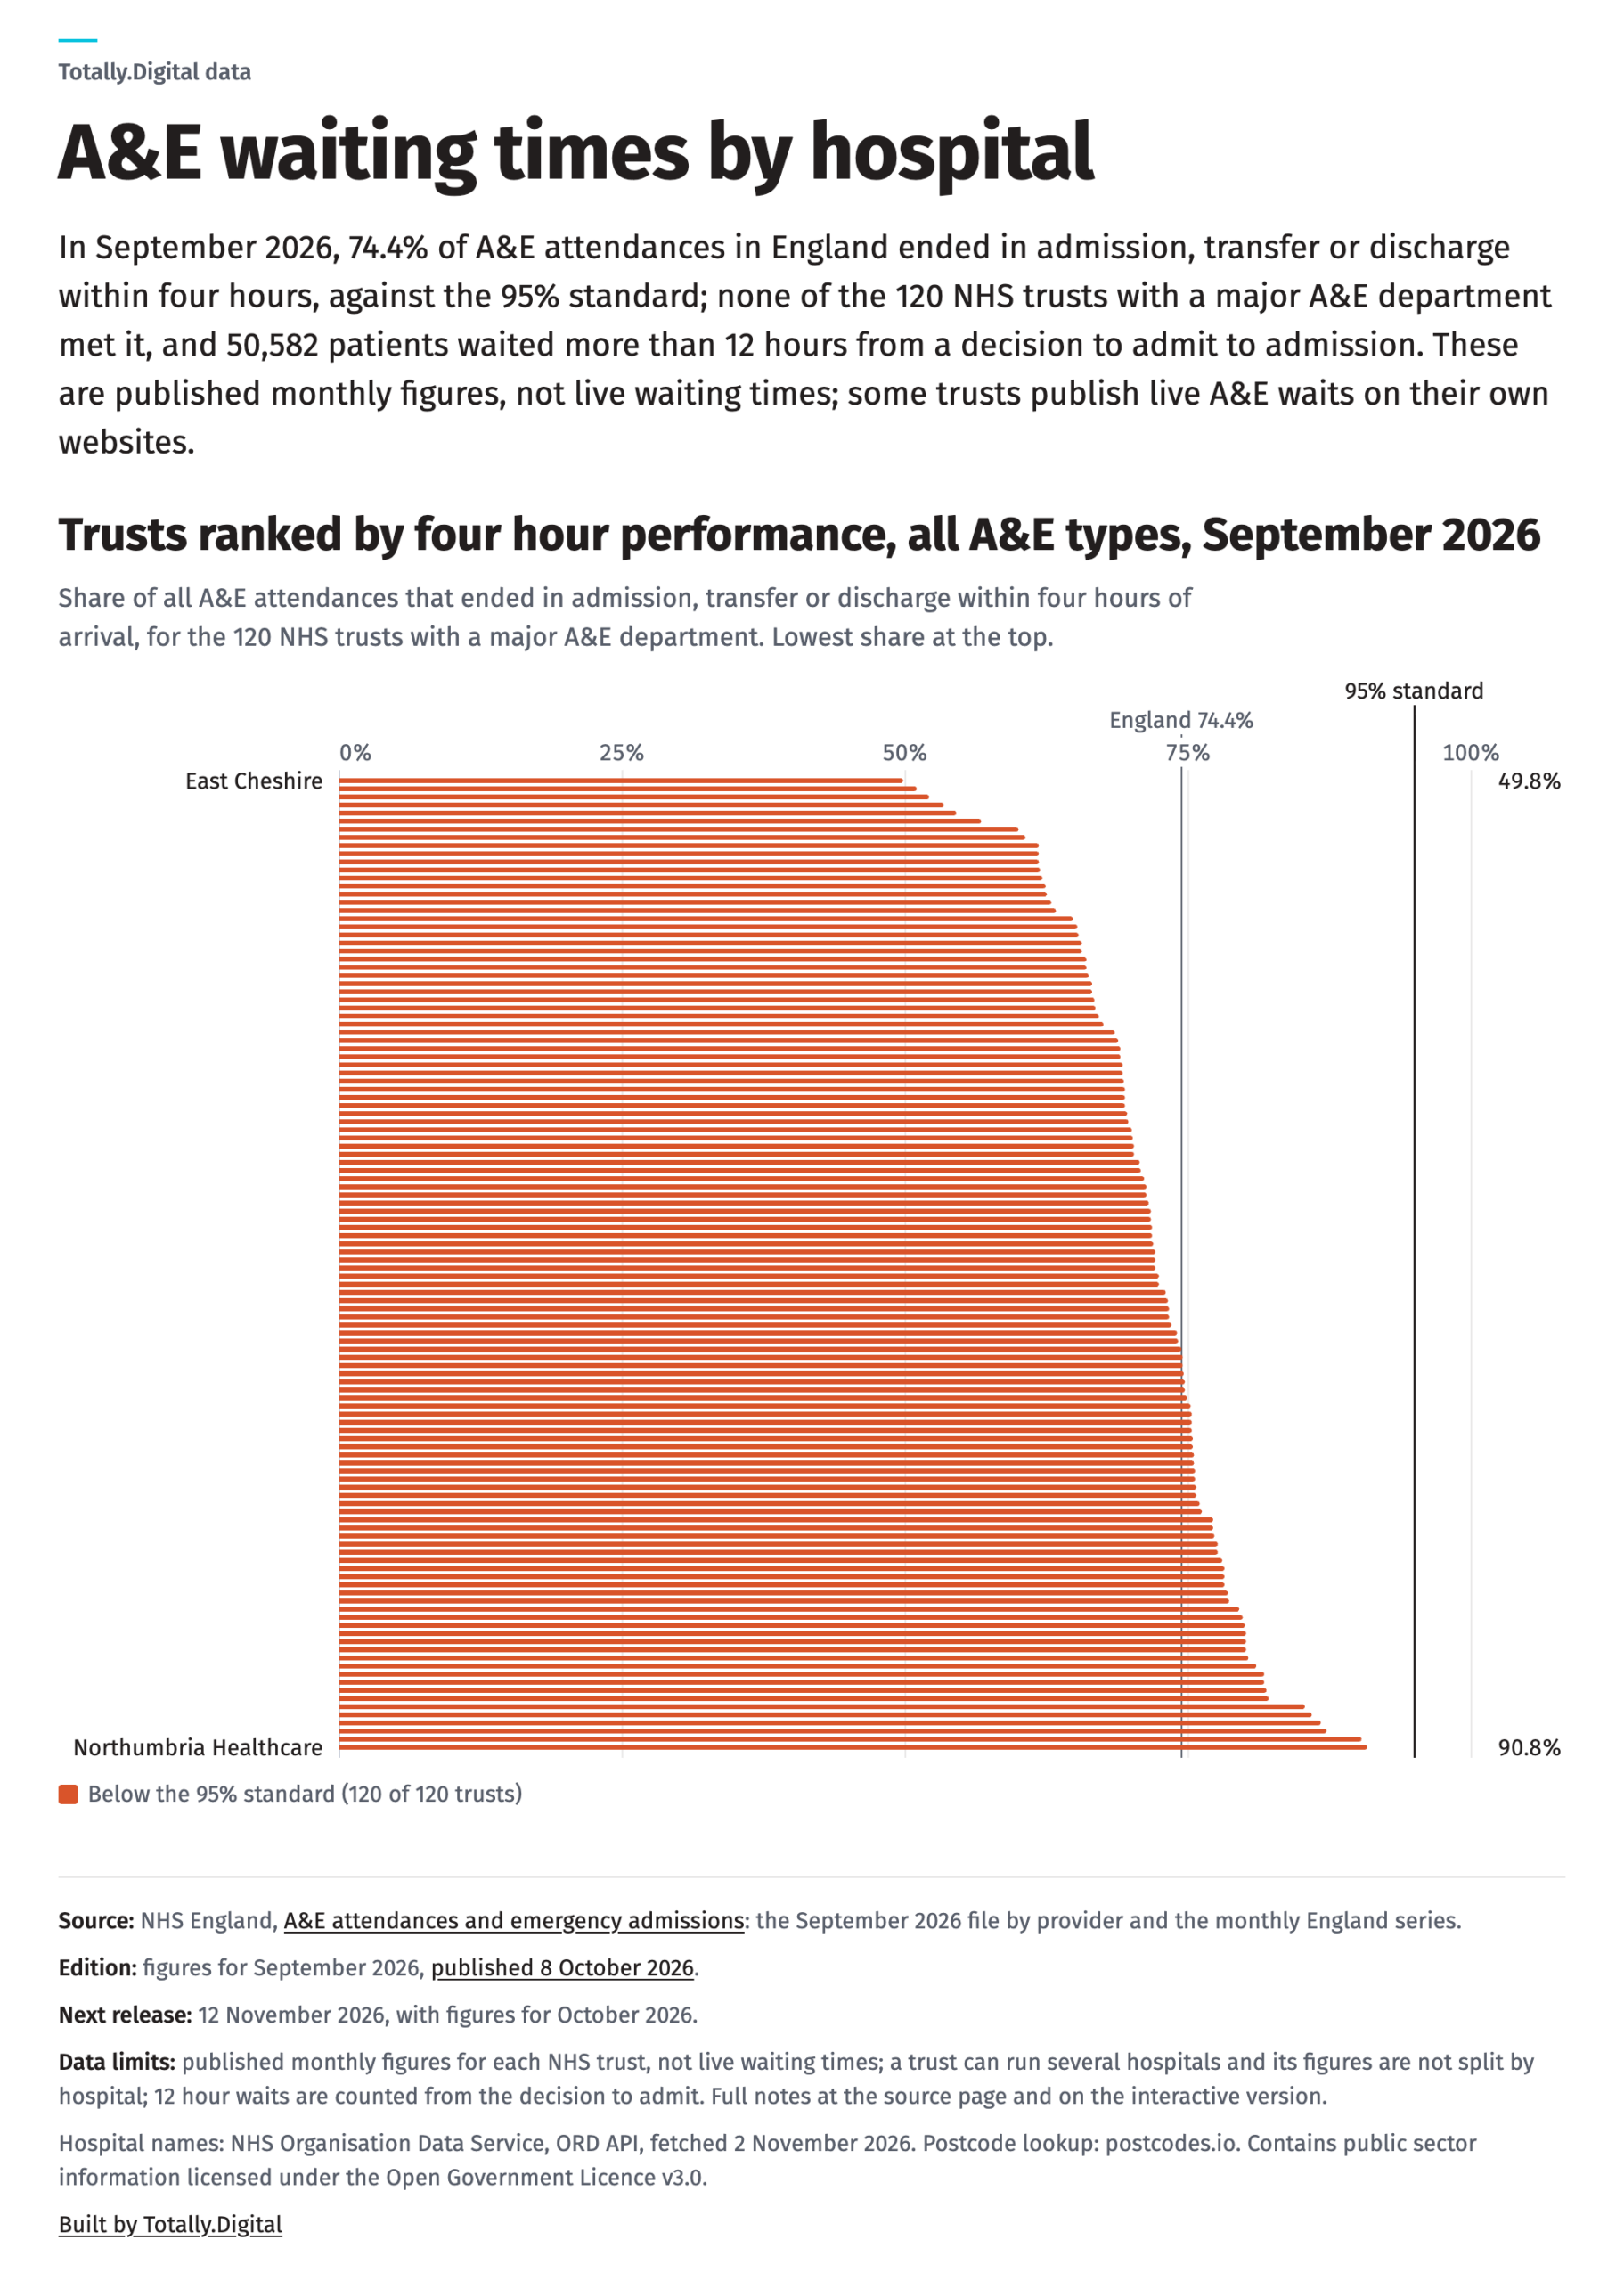
A&E waiting times by hospital
In September 2026, 74.4% of A&E patients in England were seen within four hours against the 95% standard (60.6% at major A&E departments); none of the 120 trusts with major departments met it, and 50,582 patients waited more than 12 hours after a decision to admit.
NHS England A&E attendances and emergency admissions, September 2026 (published 8 October 2026); next release 12 November 2026. Published monthly performance, not live waits
Open the a&E waiting times by hospital -
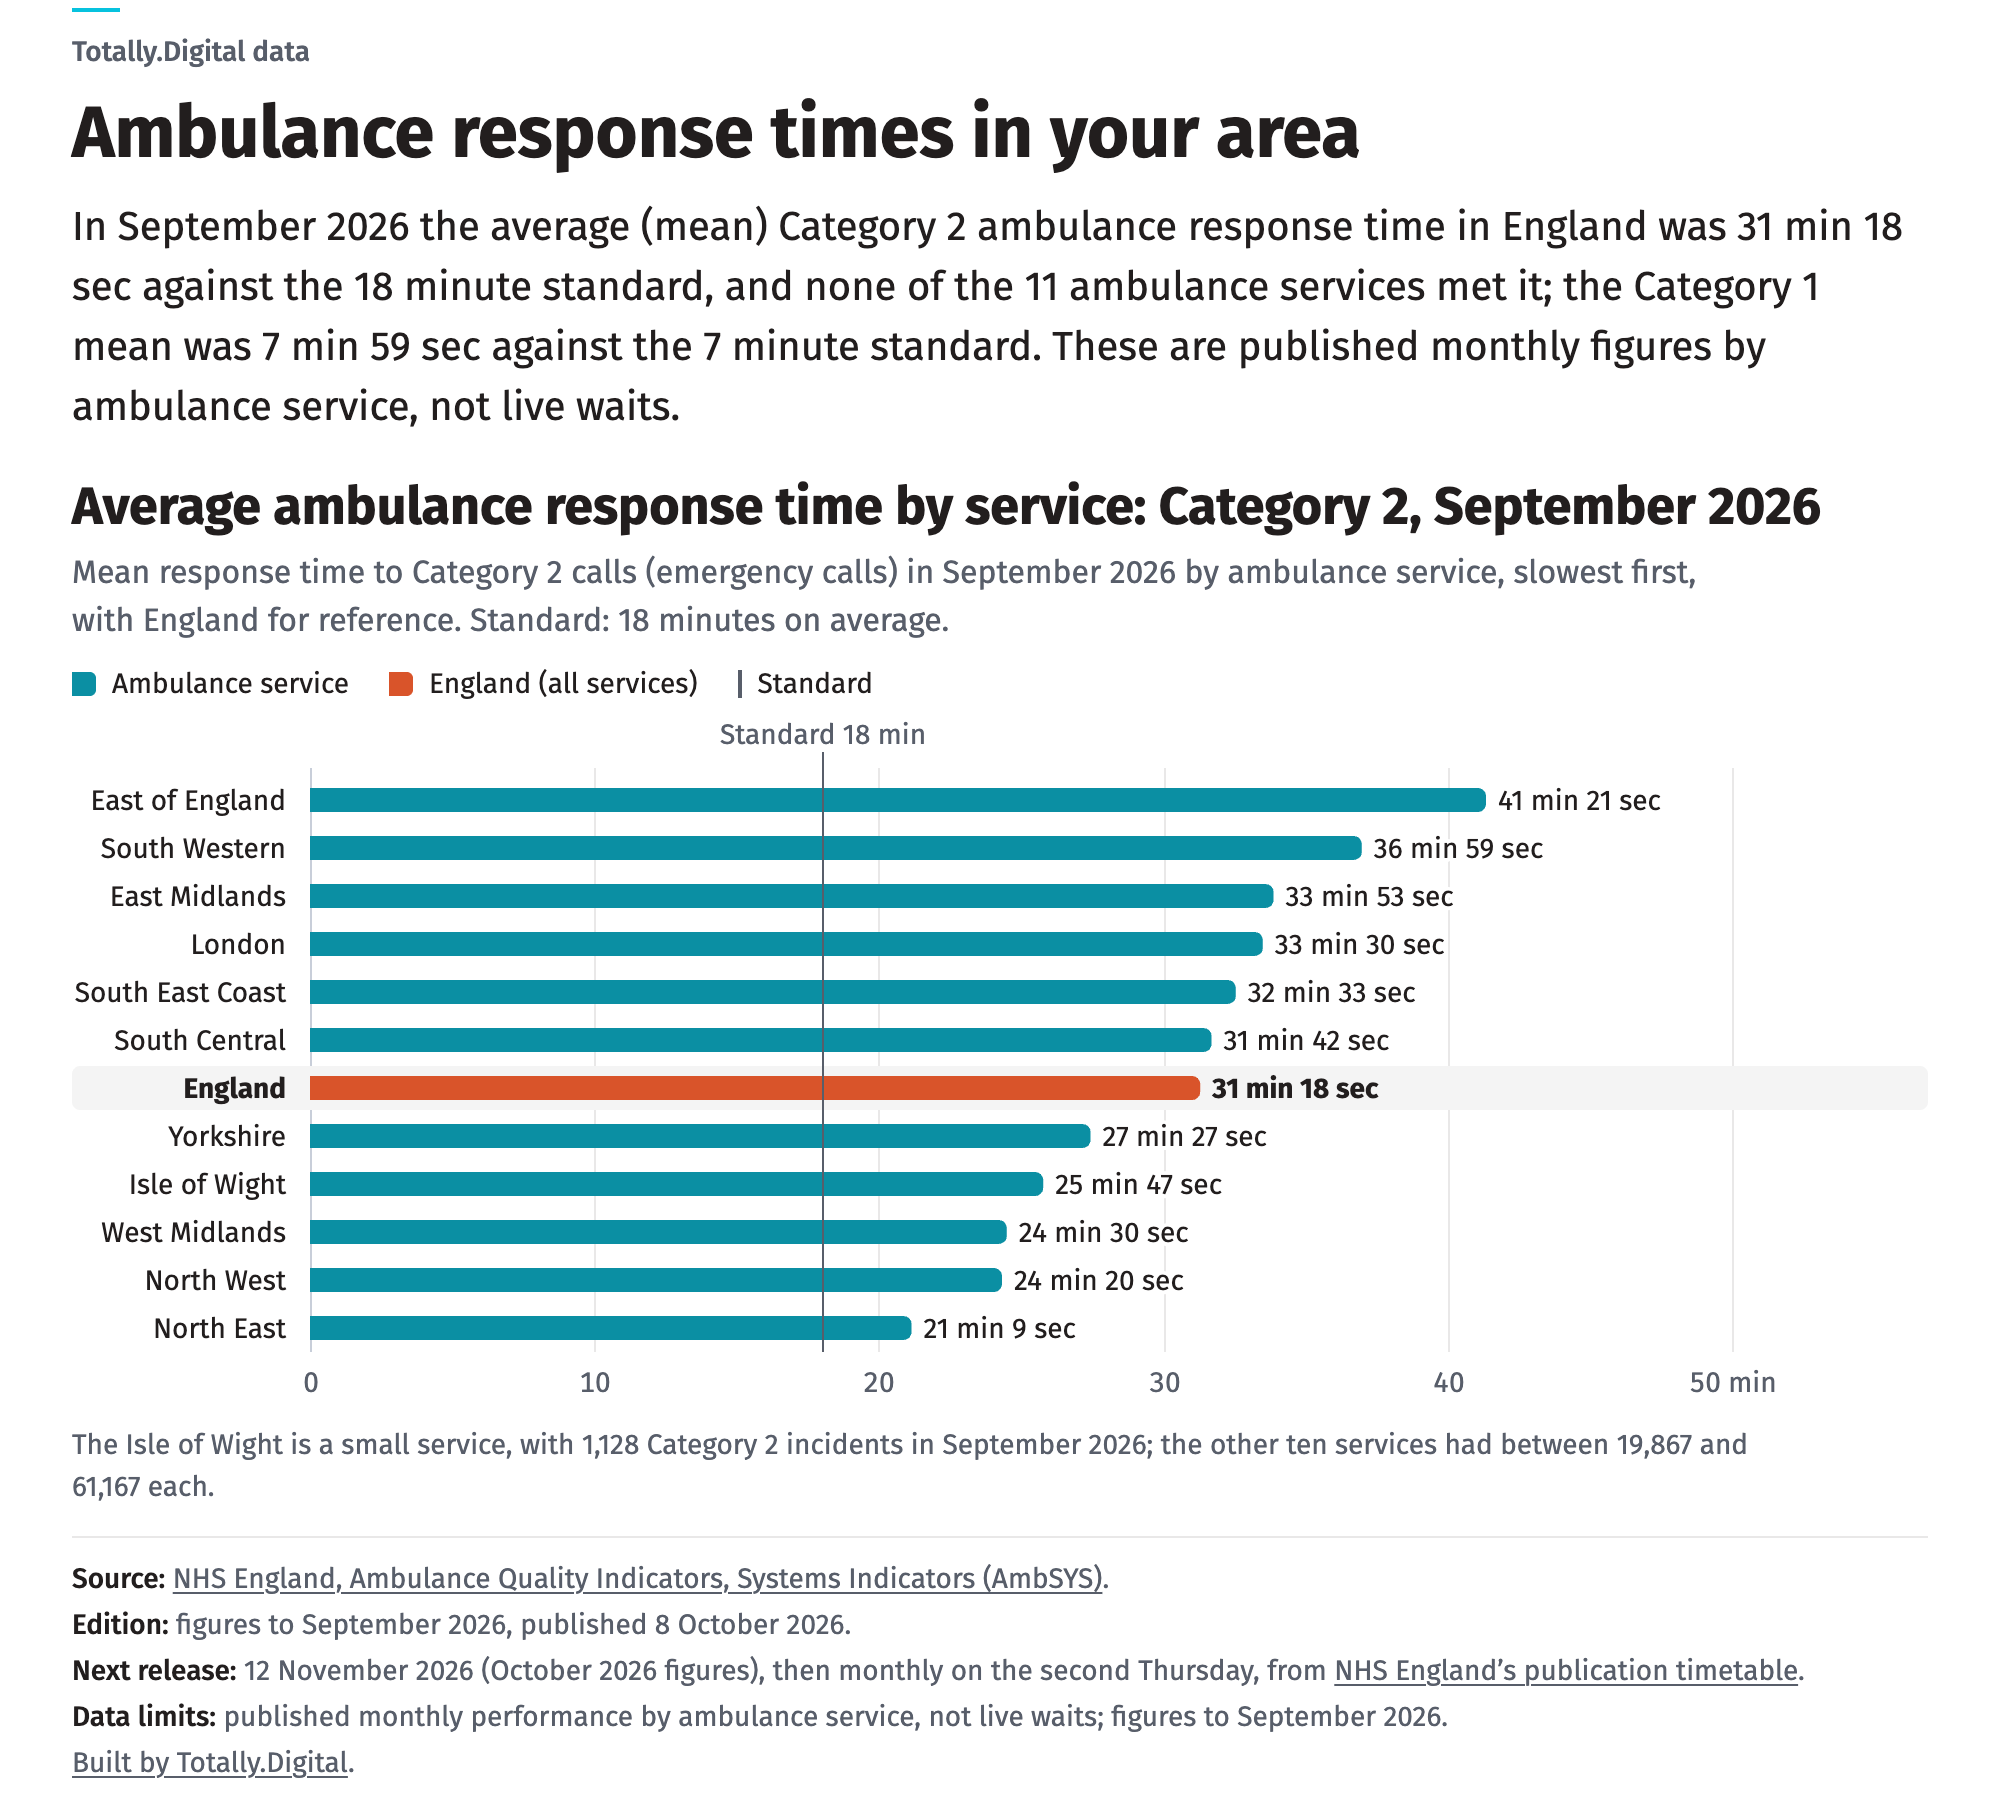
Ambulance response times in your area
In September 2026 the Category 2 mean response in England was 31 min 18 sec against the 18 minute standard, and none of the 11 ambulance services met it; Category 1 was 7 min 59 sec against 7 minutes.
NHS England Ambulance Quality Indicators, data to September 2026 (published 8 October 2026); next release 12 November 2026
Open the ambulance response times in your area -
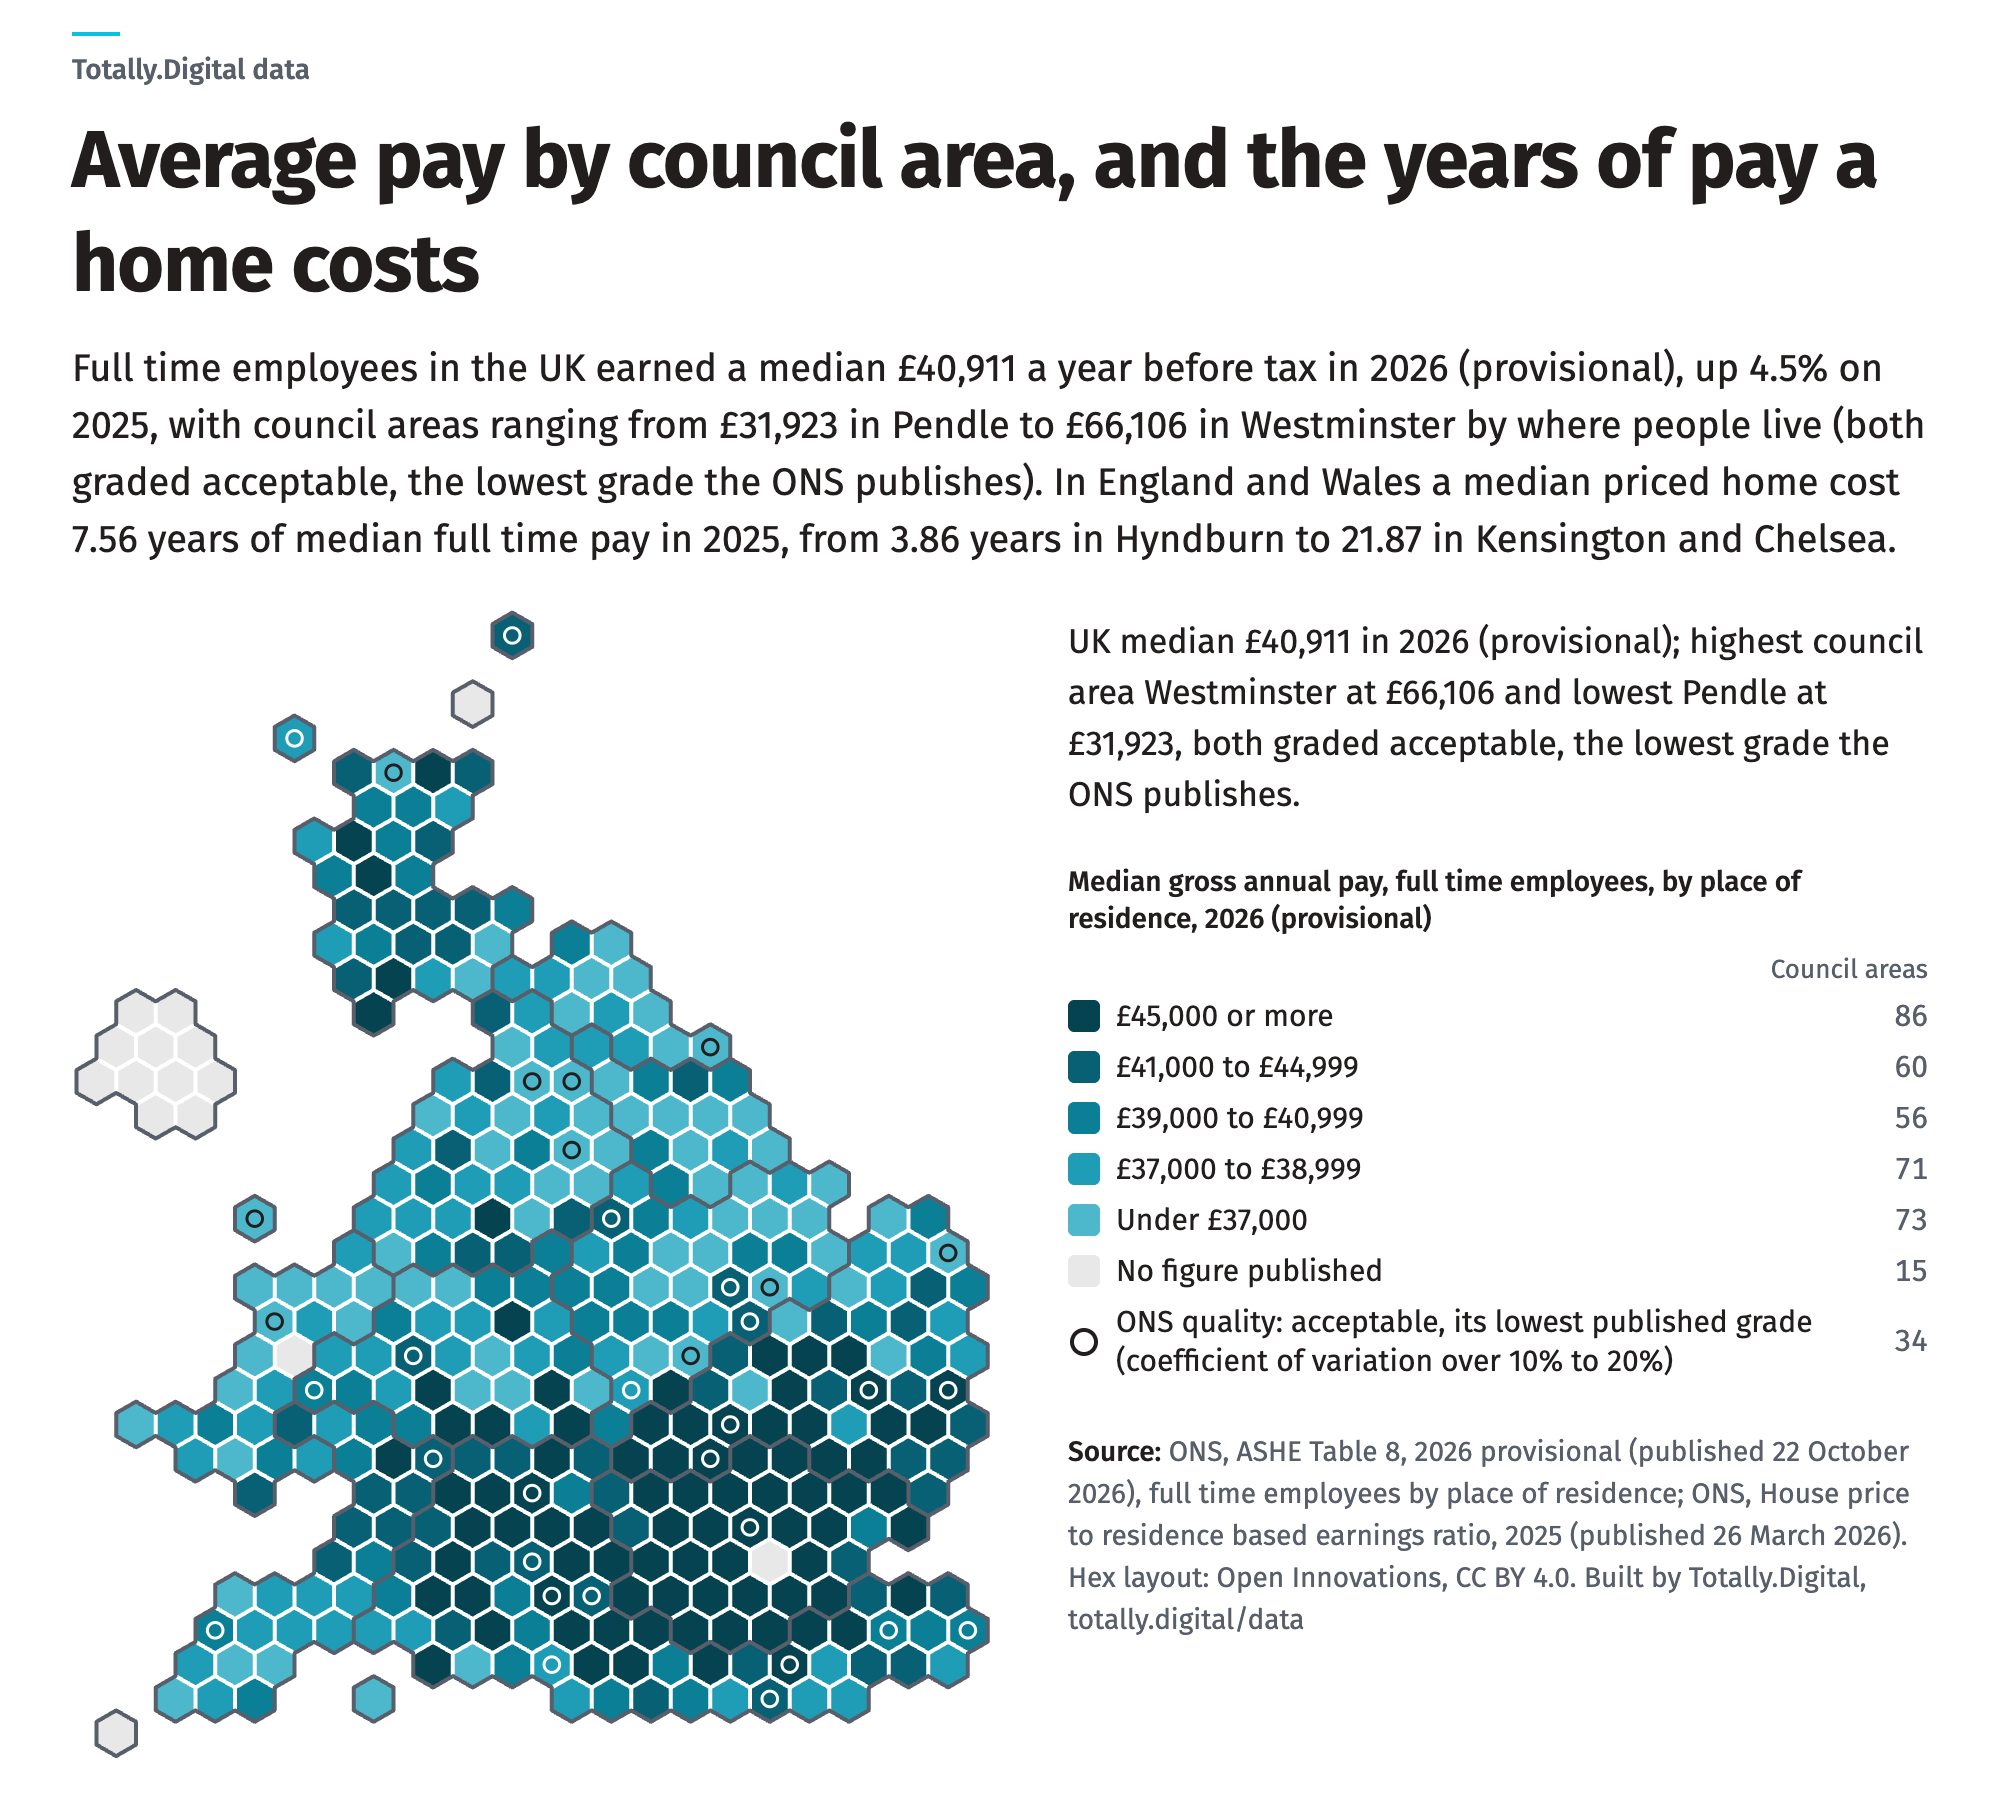
Average pay by council area, and the years of pay a home costs
The median full time salary in the UK was £40,911 in April 2026 (provisional), up 4.5% on the year; highest council area Westminster £66,106, lowest Pendle £31,923. A median priced home cost 7.6 years of median pay in England and Wales in 2025.
ONS Annual Survey of Hours and Earnings 2026 provisional (22 October 2026) and the house price to earnings ratio for 2025 (26 March 2026); next ratio release March 2027
Open the average pay by council area, and the years of pay a home costs -
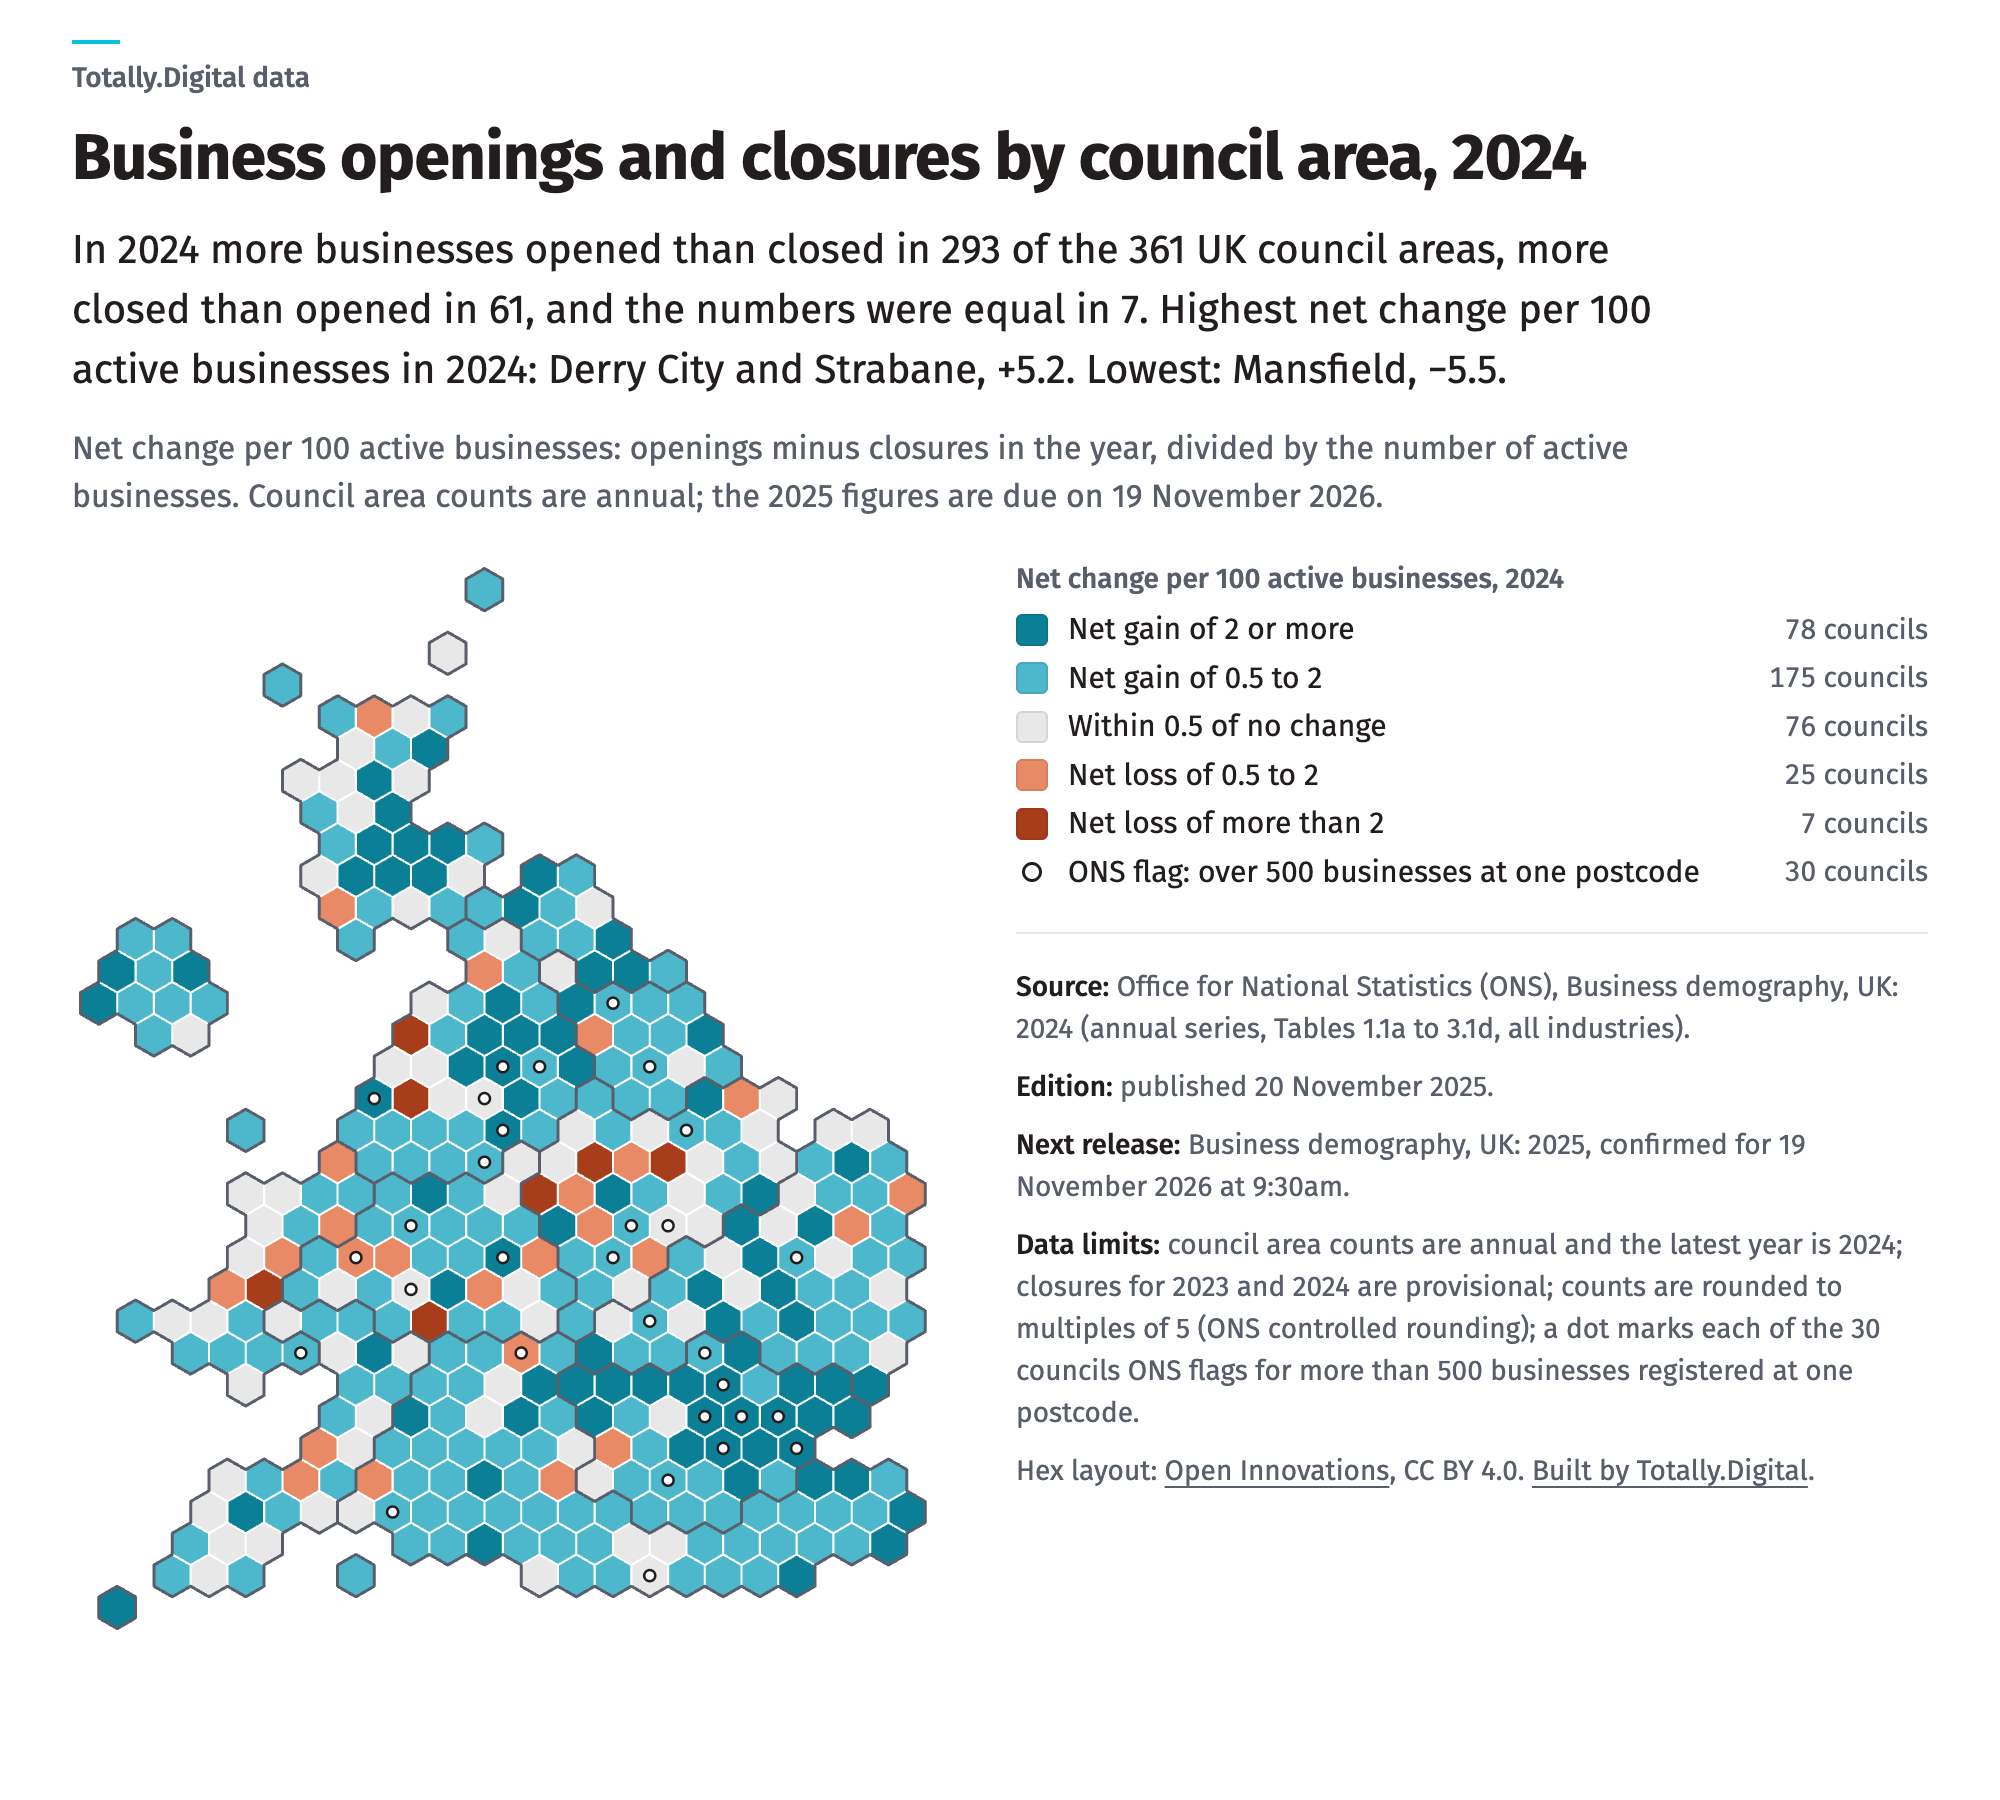
Business openings and closures in your area
In 2024, 317,440 businesses opened in the UK and 280,370 closed, a net gain of 37,070; 293 of 361 council areas gained businesses per 100 active, 61 lost.
ONS Business demography, UK: 2024 (20 November 2025) and the quarterly release of 29 October 2026; the 2025 council figures are due on 19 November 2026 at 9:30am
Open the business openings and closures in your area -
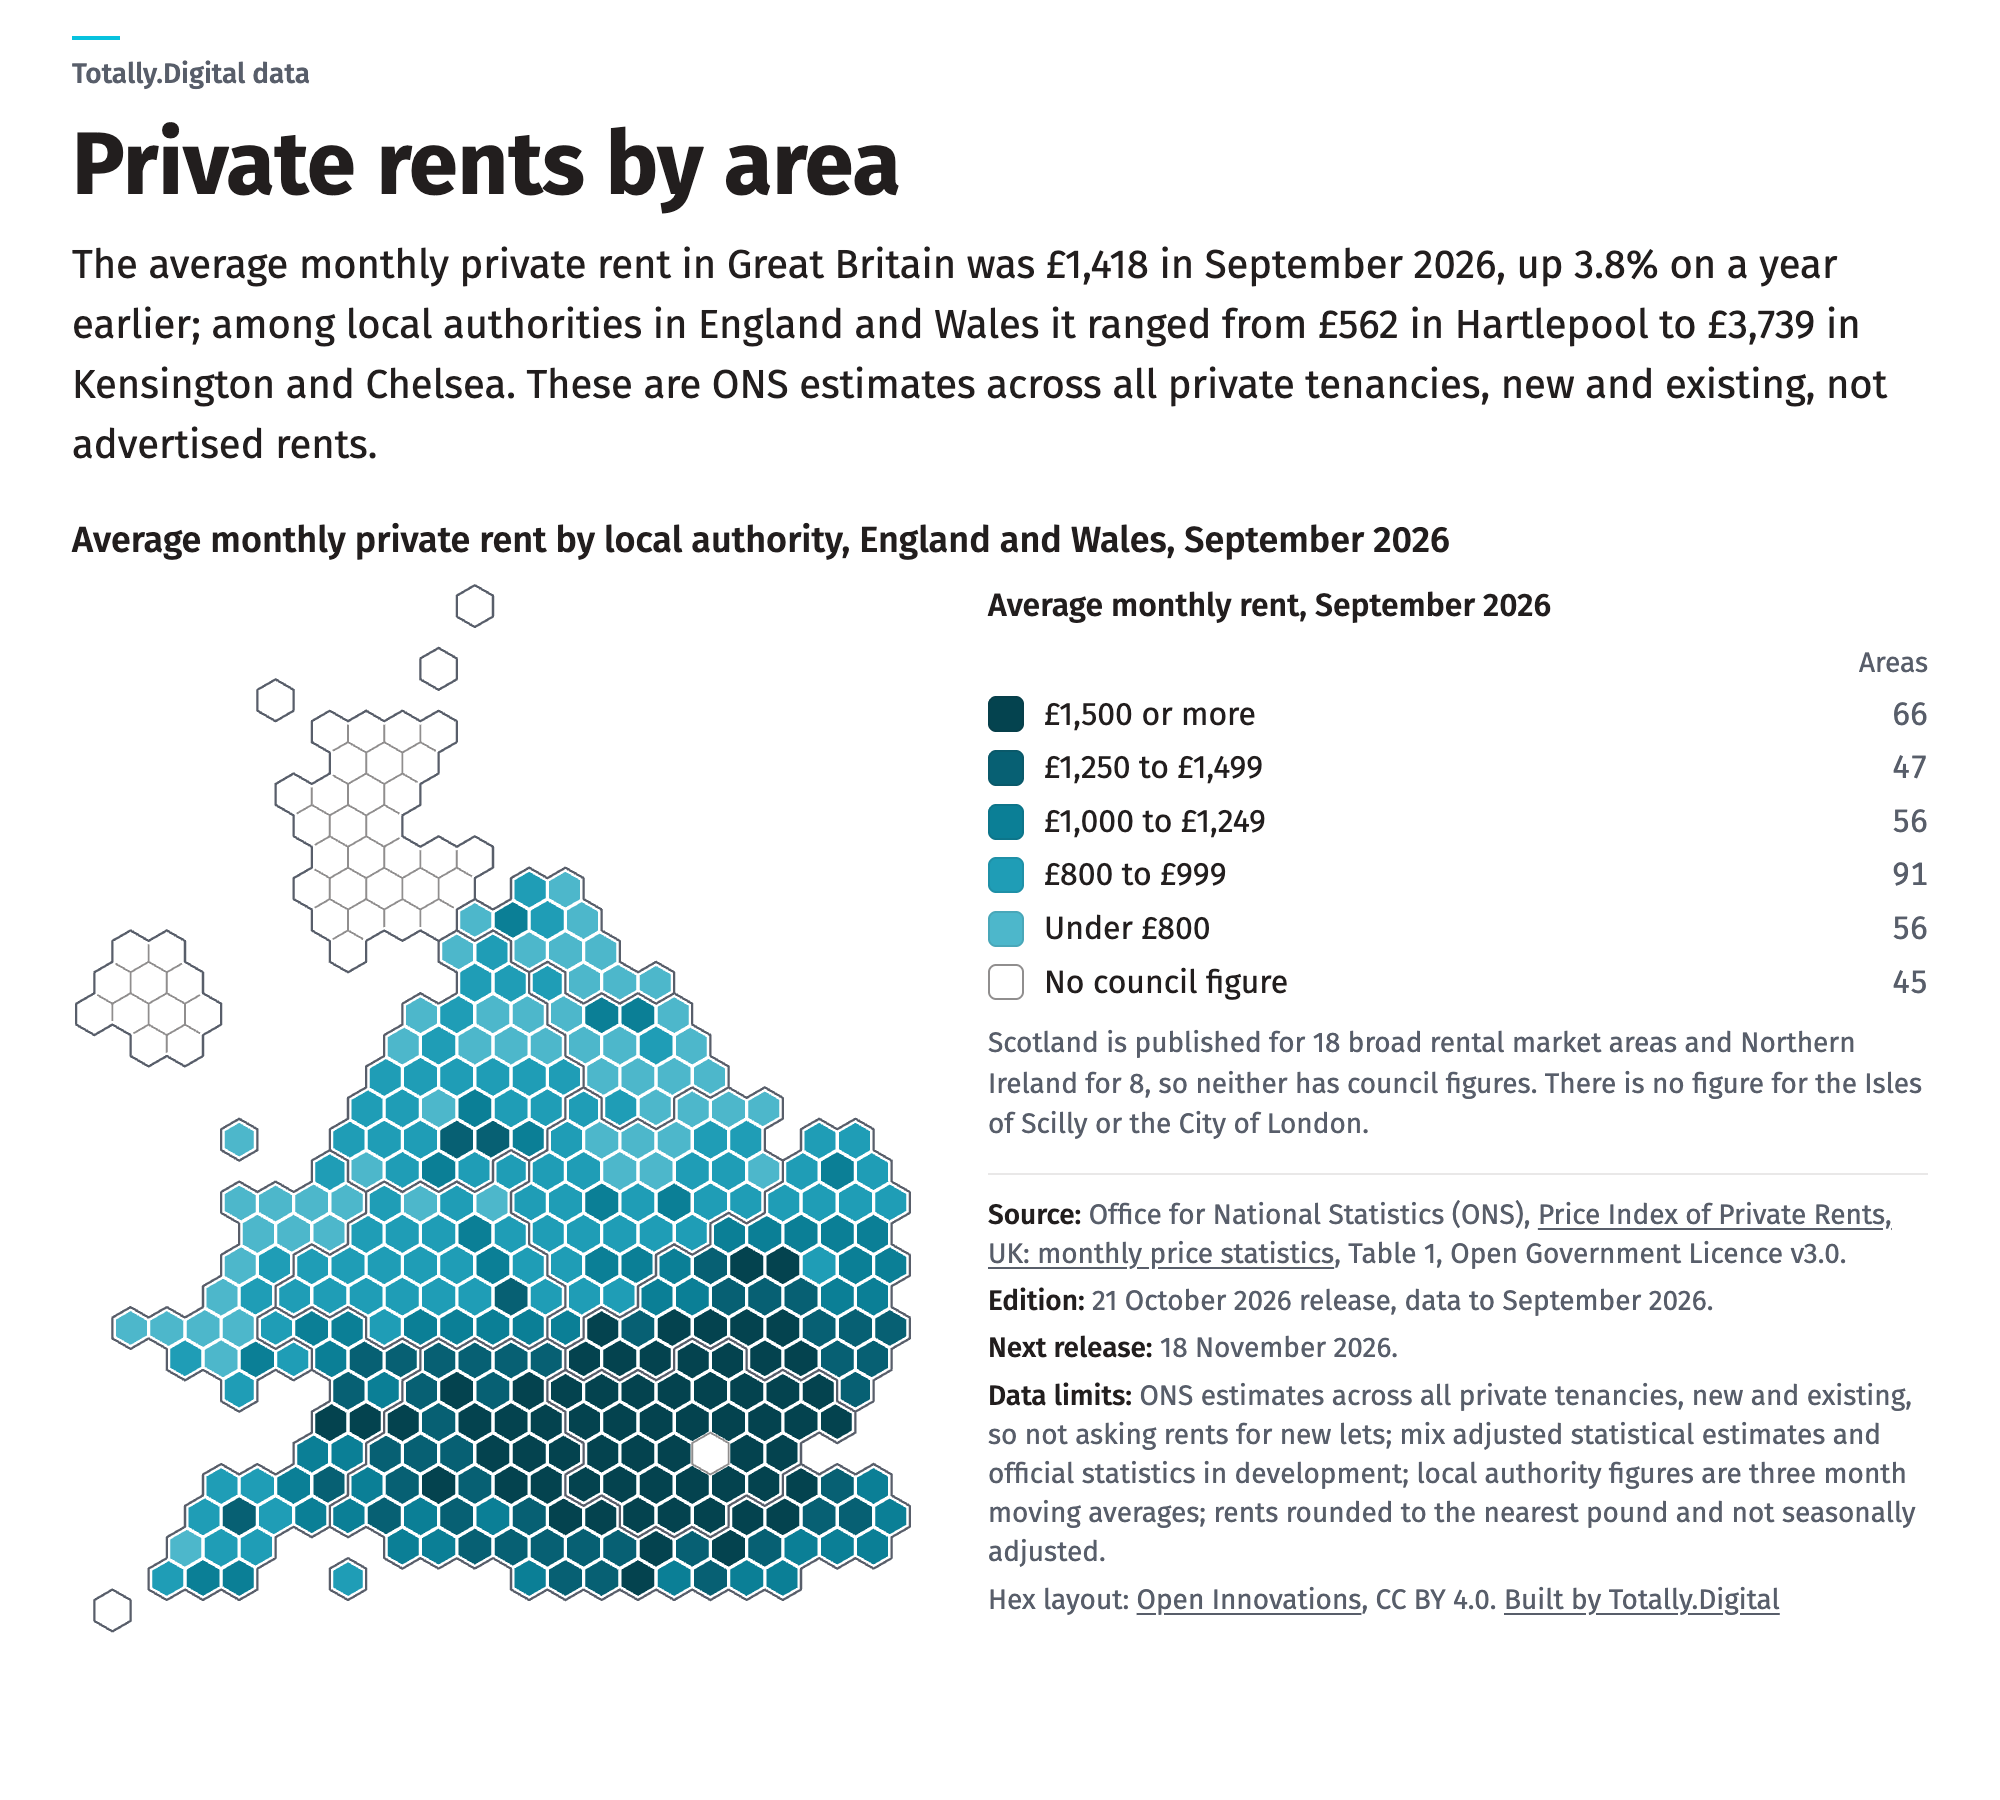
Private rents by area
The average private rent in Great Britain was £1,418 a month in September 2026, up 3.8% on the year; Kensington and Chelsea £3,739, Hartlepool £562.
ONS Price Index of Private Rents, 21 October 2026 release, data to September 2026; next release 18 November 2026
Open the private rents by area
How these pages are made
Each page takes one official dataset (NHS England, the Office for National Statistics), rebuilds it as an interactive chart or map with a table view, and prints the source, the edition, the next release date and the limits of the data in its footer. Figures are never shown without the measure and the period they belong to. The pages are refreshed when the publisher releases a new edition, and the edition line on each page says which release it shows.
The charts and the images on these pages may be reused in articles and reports with a credit to Totally.Digital and a link to the page they came from. The underlying figures belong to their publishers and are published under the Open Government Licence v3.0.
Totally has built data pieces for the press since 2014, from the 2015 selfie map that MailOnline ran to the ambulance response times map the Guardian Datablog covered: the story of those pieces and how we build them. PR network members and other agencies: we can do this for your clients.
Built by Totally.Digital. Hex map layouts by Open Innovations (CC BY 4.0). Postcode lookups by postcodes.io.